Technical Breakdown
Project Overview: DevOpsLab
DevOpsLab is a self-hosted, independent virtualized infrastructure cluster designed to simulate a modern cloud provider environment right on physical hardware. Rather than relying on managed cloud dependencies, DevOpsLab hosts its own DNS resolvers, container registries, reverse proxies, and logging pipelines—running entirely locally.
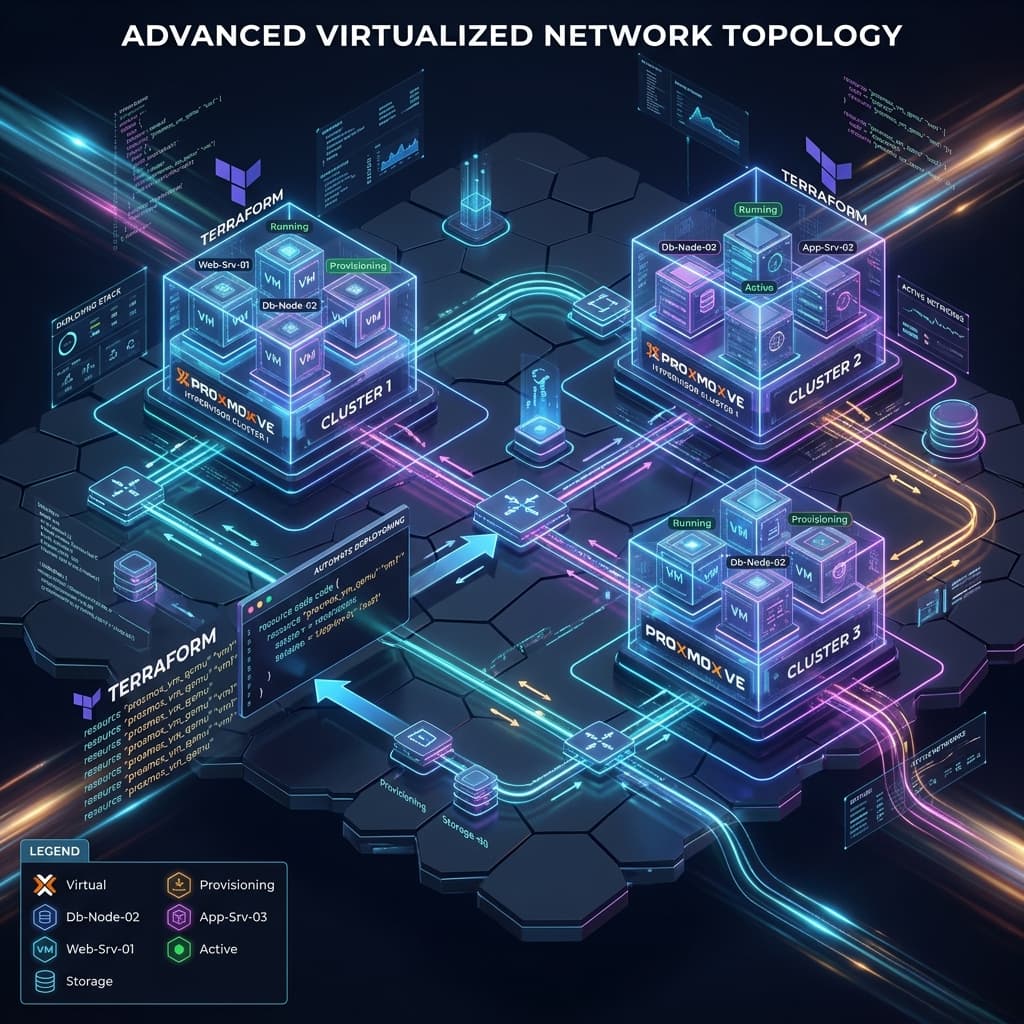
The entire virtualization lifecycle is treated as software. Virtual machines are declared in Terraform configs, configured automatically via Ansible playbooks, and updated continuously using an automated GitOps pipeline.
🗺️ Physical & Virtual Topology
The physical cluster runs on a triple-node array of low-power mini PCs, clustered together to share local NVMe storage and orchestrate guest distributions:
🛡️ Hosted Core Services & Deep Pros & Cons
To achieve complete hosting independence, DevOpsLab hosts its own system service matrix. Below is an exhaustive breakdown of the architectural components, their roles, and their real-world trade-offs:
1. Hypervisor & Infrastructure Management (Proxmox VE)
- Role: Bare-metal Type-1 hypervisor running a clustered Debian foundation to manage virtual environments.
- Pros:
- Near-Zero Overhead: Provides bare-metal performance for both VMs (KVM) and lightweight Linux Containers (LXC).
- Developer API: Excellent native REST API enabling seamless integration with custom scripts and Terraform.
- Proxmox Backup Server (PBS): Out-of-the-box support for hyper-efficient, incremental, and deduplicated backup policies.
- Cons:
- High Availability Overhead: Setting up high availability (HA) requires a strict minimum of three nodes to establish quorum (or a separate QDevice vote node).
- Host OS Maintenance: Major version upgrades require manual Debian administration through the terminal, introducing risk if host configurations are not kept standard.
2. Local DNS & Service Discovery (Technitium DNS)
- Role: An authoritative and recursive internal DNS server that maps local domain entries (
*.homelab.local) to Traefik routing nodes. - Pros:
- Self-Hosted Resolution: Resolves internal queries locally without transmitting DNS logs to external providers.
- DNS-over-HTTPS (DoH) / DNS-over-TLS (DoT): Supports encrypted upstreams out of the box.
- Wildcard Record Mapping: Simplifies domain maps so new Kubernetes ingress rules are resolved instantly.
- Cons:
- Single Point of Failure: If the primary DNS server fails, all cluster service discovery and internet resolution drops. Requires a secondary hot-standby replication sync.
3. Edge Routing & Certificate Automation (Traefik Proxy)
- Role: Edge reverse proxy and load balancer that routes public and internal HTTPS traffic while managing Let's Encrypt SSL certificates automatically.
- Pros:
- Dynamic Configuration: Integrates natively with Docker and Kubernetes APIs to auto-discover active endpoints.
- Let's Encrypt integration: Handles SSL handshakes and automatically renews wildcards via DNS challenge solvers.
- Middleware Chains: Easy integration of rate limiting, IP whitelists, and OAuth authentications.
- Cons:
- Configuration Syntax Complexity: Moving between file-based YAML configurations, Kubernetes Custom Resource Definitions (CRDs), and Docker labels can lead to configuration errors.
4. Container Orchestration (K3s Kubernetes Cluster)
- Role: A lightweight, CNCF-certified Kubernetes distribution optimized for low-resource footprints.
- Pros:
- Extremely Low Resource Footprint: Runs a fully functional control plane on less than 1GB of RAM.
- Single-Binary Installation: Packages all Kubernetes components in a single binary, greatly simplifying automated deployments.
- Production Parity: Runs the exact same Helm charts and manifests that run on AWS EKS or Google GKE.
- Cons:
- Embedded Database Constraints: By default, K3s uses SQLite. To scale it to high-availability multi-master layouts, you must configure a separate external datastore (like PostgreSQL or etcd), raising architectural complexity.
5. GitOps Continuous Delivery (ArgoCD)
- Role: A declarative GitOps continuous delivery tool that monitors a Git repository and automatically synchronizes the cluster state with target repository manifests.
- Pros:
- Automated State Convergence: Eliminates configuration drift by continuously reconciling cluster resources with Git declarations.
- Visual Control Plane: Beautiful visual dashboard depicting deployment dependencies and real-time health checks.
- Zero Local Configs: All applications are defined strictly as code. A total cluster wipe can be fully restored in minutes by pointing ArgoCD back at your Git repository.
- Cons:
- Bootstrap Complexity: Setting up the initial ArgoCD repository loop, secrets, and repository credentials from scratch requires careful planning.
💻 Infrastructure-as-Code Configuration Examples
A. Terraform: Provisioning a Proxmox VM Template
# main.tf - Deploys a base Ubuntu VM from a golden template
resource "proxmox_vm_qemu" "k3s_worker" {
  count       = 2
  name        = "devops-k3s-worker-0${count.index + 1}"
  target_node = "devops-node-01"
  clone       = "ubuntu-2204-cloudimage-template"

  cores   = 2
  sockets = 1
  memory  = 2048
  agent   = 1

  disk {
    size    = "20G"
    type    = "scsi"
    storage = "local-lvm"
  }

  network {
    model  = "virtio"
    bridge = "vmbr0"
  }

  ipconfig0 = "ip=10.0.10.2${count.index + 1}/24,gw=10.0.10.1"
}
B. Ansible: Automated Docker & Microk8s Setup
# playbook.yml - Configures guest OS features automatically
- name: Configure Guest Nodes
  hosts: kubernetes_nodes
  become: true
  tasks:
    - name: Install required system packages
      apt:
        name:
          - curl
          - apt-transport-https
          - ca-certificates
          - gnupg
        state: present
        update_cache: yes

    - name: Enable kernel cgroups limits
      lineinfile:
        path: /boot/cmdline.txt
        backrefs: yes
        regexp: '(^.*(?!.*\bcgroup_enable=cpuset\b).*$)'
        line: '\1 cgroup_enable=cpuset cgroup_enable=memory cgroup_memory=1'
      notify: Reboot System
📈 Centralized Observability & Telemetry
Observability in DevOpsLab is handled via a dedicated telemetry pipeline. Prometheus scrapes metrics from the node-exporter running on the Proxmox host and the Kubernetes cluster, forwarding them directly to Grafana for detailed analytics.
Host Node Metrics (CPU/RAM/Temp) ──┐
Kubernetes API Metrics             ├──> [Prometheus Server] ──> [Grafana Dashboard]
Traefik Ingress Traffic Logs       ──┘
💡 Key Architectural Lessons Learned
- Strict Isolation: Keep the hypervisor host OS completely clean. Never run user containers directly on the bare-metal Proxmox shell; isolate all workloads into designated guest systems.
- Backups are Mandatory: Automate daily virtual machine state backups to an external storage endpoint. A corrupt cluster node should never result in configuration losses.
- Always Automate DNS: Relying on IP addresses for internal nodes leads to fragile endpoints. Setting up independent local DNS maps is critical for professional-grade configurations.